← Back to work
Tool
A reporting dashboard that turns raw data into a weekly readout
- Client
- Anonymised client
- Industry
- Reporting & analytics
- Team size
- Not disclosed
- Location
- NZ
The problem.
Performance data was scattered across platforms, so getting a straight answer to "how did we do this week?" meant pulling numbers by hand from several tools and hoping they lined up.
What we built.
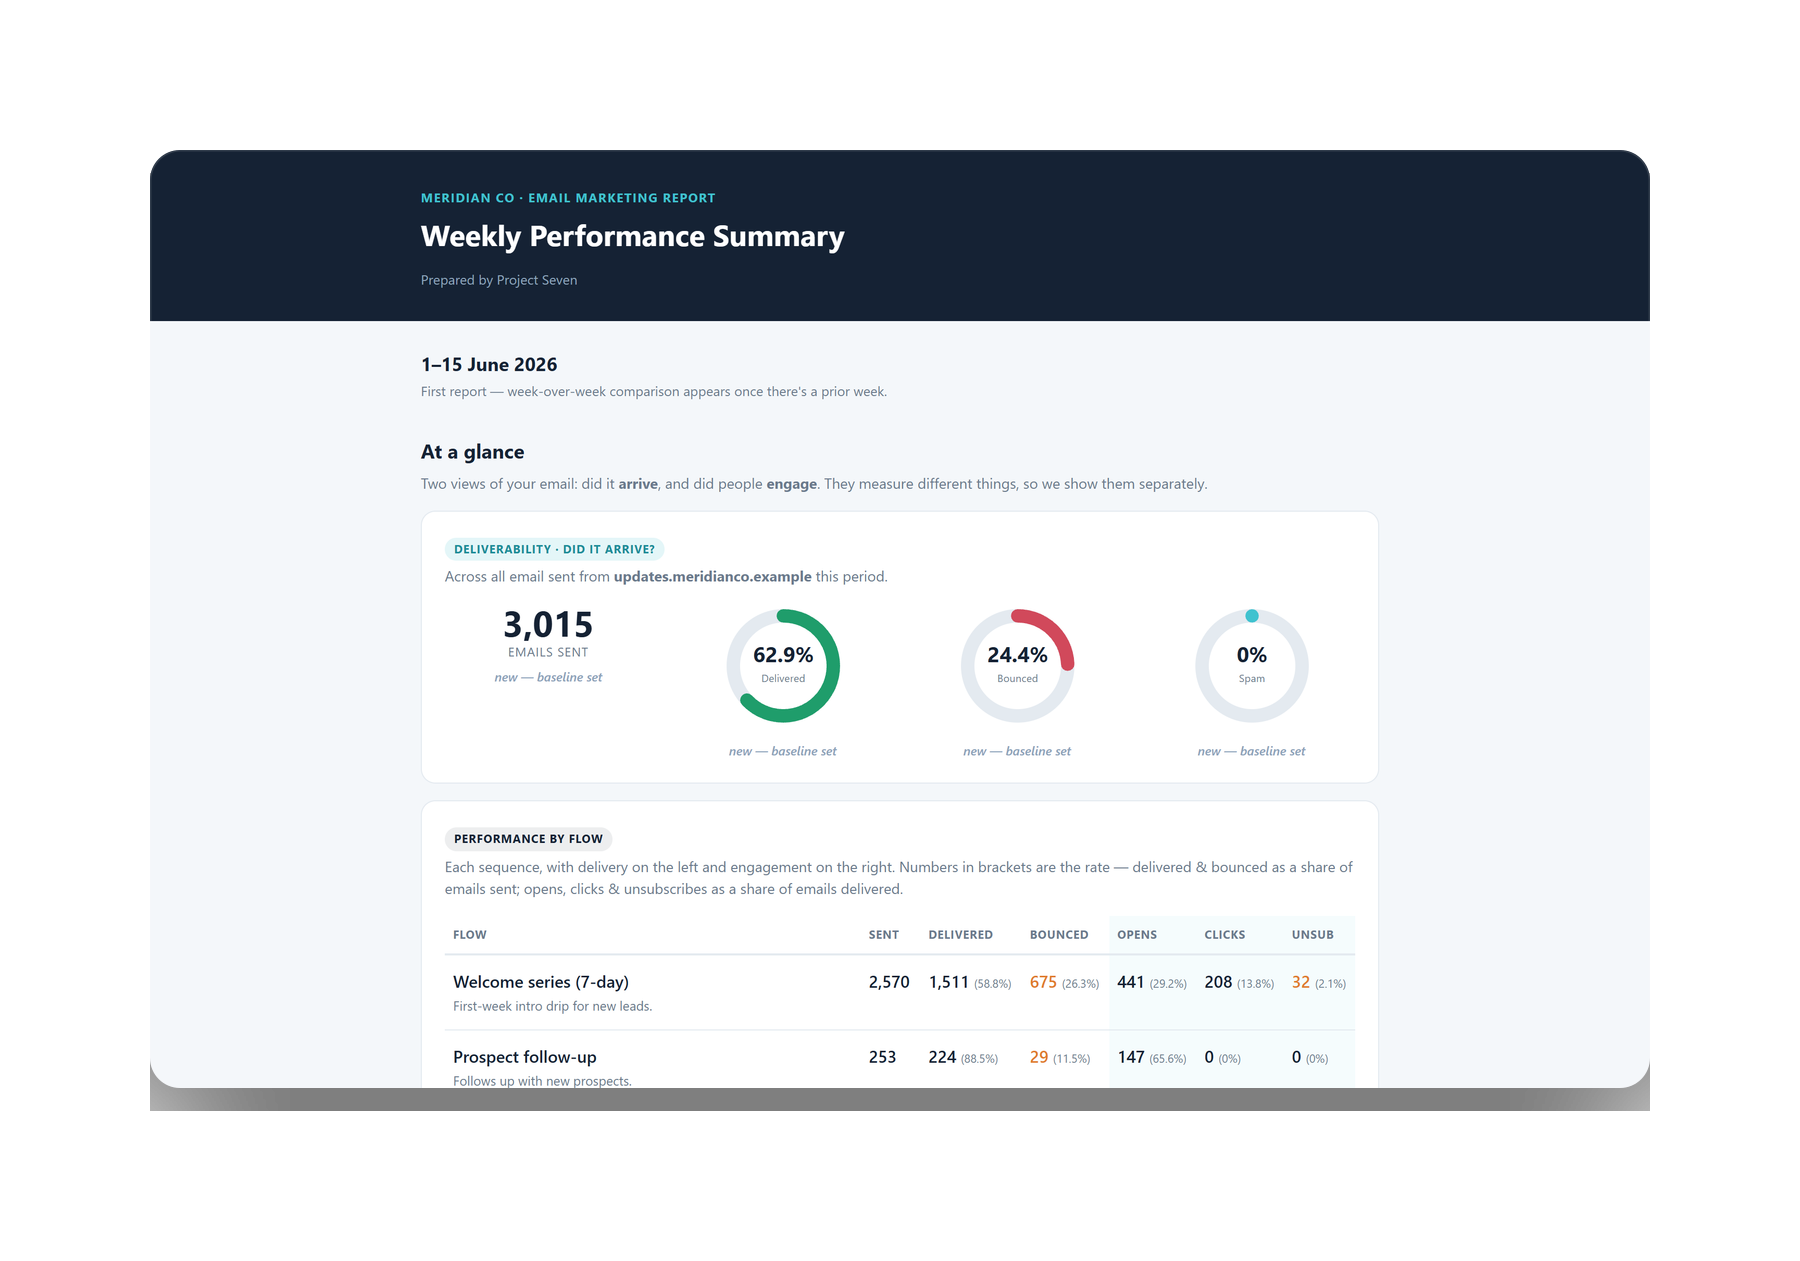
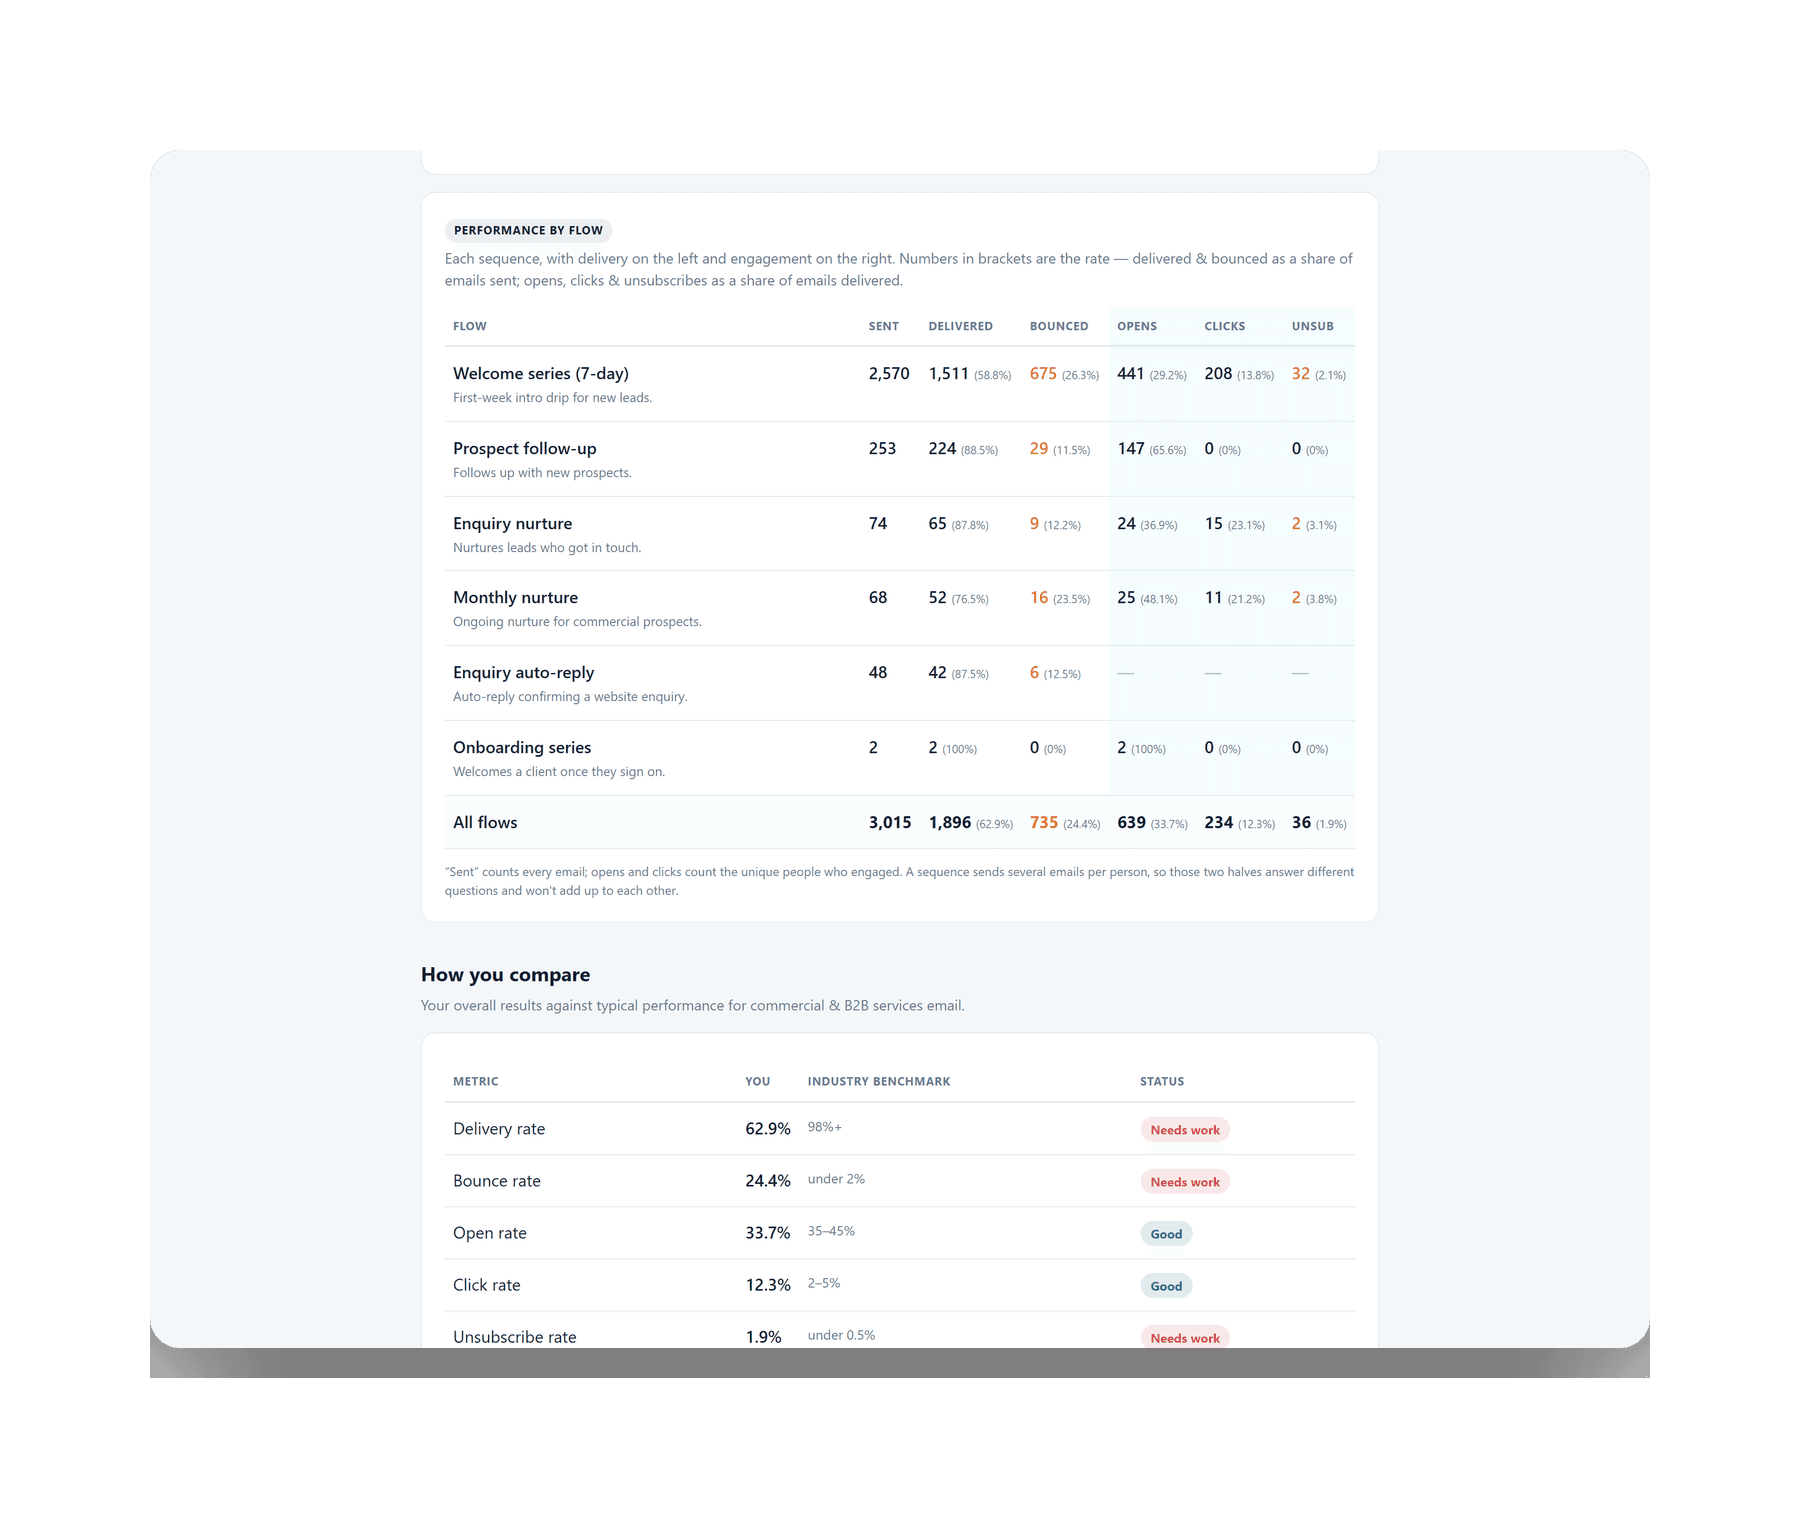
A custom reporting dashboard that pulls the data together and renders a clear weekly readout: deliverability at a glance and a per-flow performance breakdown, built around the metrics that matter and owned by the business.
How it works.
- Pull the data
Connected the campaign and operational data sources into one place.
- Shape the metrics
Defined the numbers that matter, not vanity stats.
- Render the readout
A clear weekly dashboard: deliverability summary and per-flow breakdown.
- Owned
Runs on their own infrastructure, theirs to keep.
Tell us what’s slowing you down.
A short conversation, then a clear plan for what we’d build. No pitch, no jargon.